


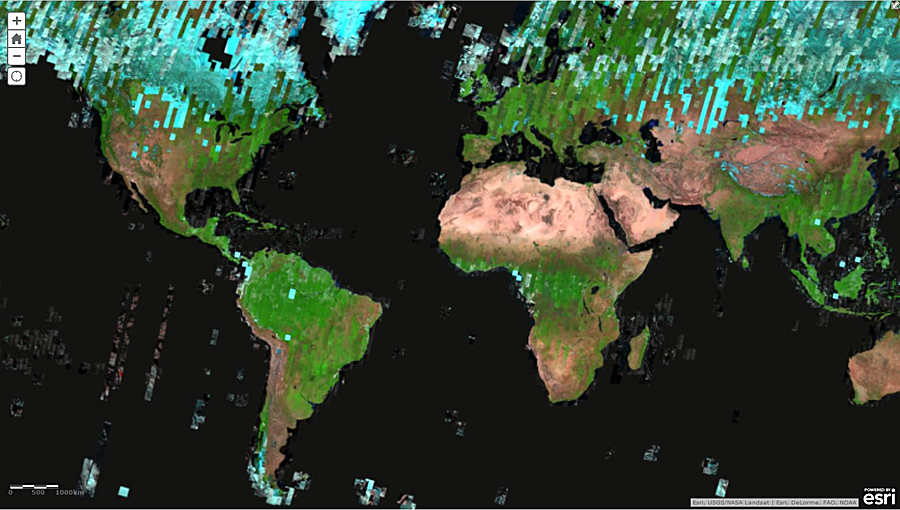


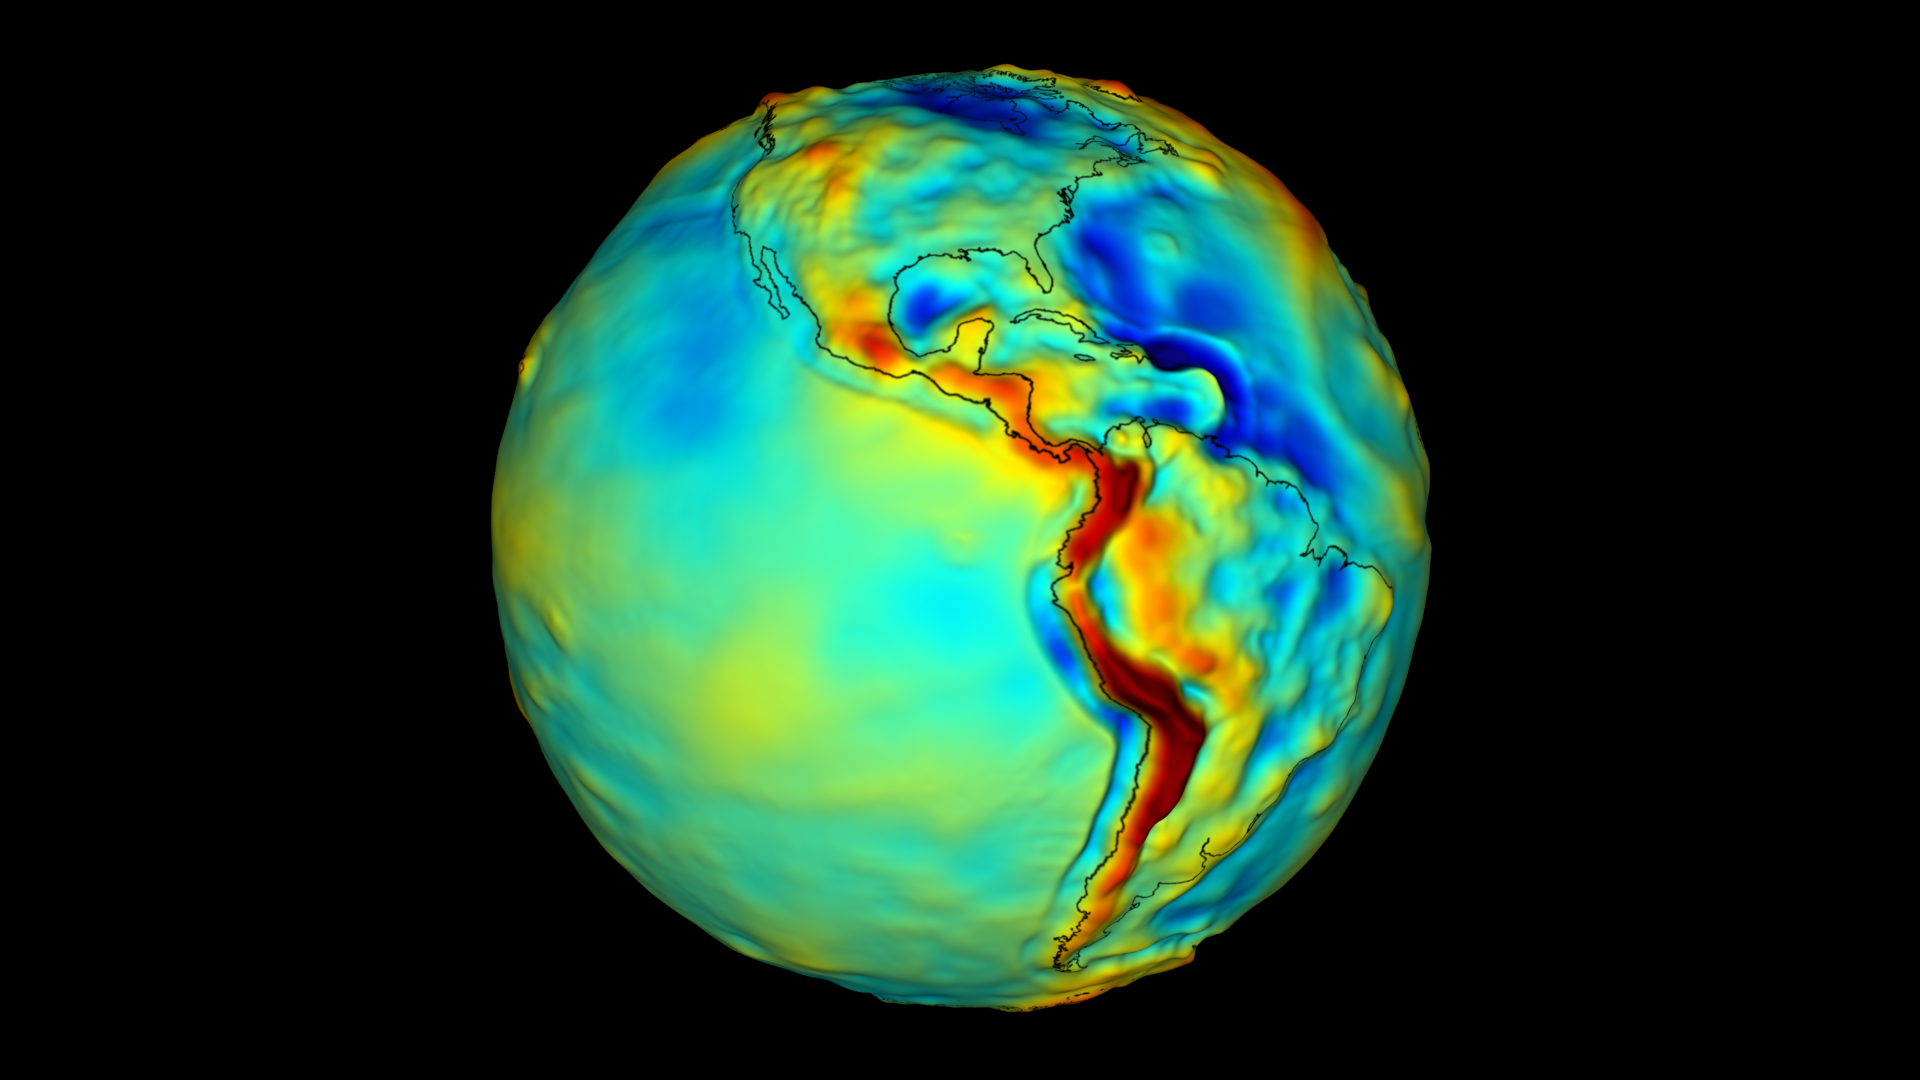


Using Landsat imagery and cloud computing, researchers mapped forest cover worldwide as well as forest loss and gain. Over 12 years, 888,000 square miles (2.3 million square kilometers) of forest were lost, and 309,000 square miles (800,000 square kilometers) regrew.
Image Credit: NASA Goddard, based on data from Hansen et al., 2013.
The ravages of deforestation, wildfires, windstorms and insects on global forests during this century are revealed in unprecedented detail in a new study based on data from the NASA-U.S. Geological Survey Landsat 7 satellite.

The border between Malaysia and Indonesia on the island of Borneo stands out in the Landsat-based map of forest disturbance. Red pixels represent forest loss between 2000 and 2012.
Image Credit: NASA Goddard, based on data from Hansen et al., 2013.
The maps resulting from the study are the first to document forest loss and gain using a consistent method around the globe, at high resolution. They allow scientists to compare forest changes in different countries and monitor annual deforestation. With each pixel in a Landsat image showing an area about the size of a baseball diamond, researchers see enough detail to tell local, regional and global stories.
The american researchers,analyzed 143 billion pixels in 654,000 Landsat images to compile maps of forest loss and gain between 2000 and 2012. During that period, 888,000 square miles (2.3 million square kilometers) of forest were lost, and 309,000 square miles (800,000 square kilometers).
This map will be of great utility in the study region in order to define the one hand states that have adopted green policies while on the other hand states that are making strong deforestation policies.
Source NASA.GOV